
The cost of a quiet start in IPL 2026The first 10 balls are where the fate of all 10 franchises and numerous players is being decided this IPL season.
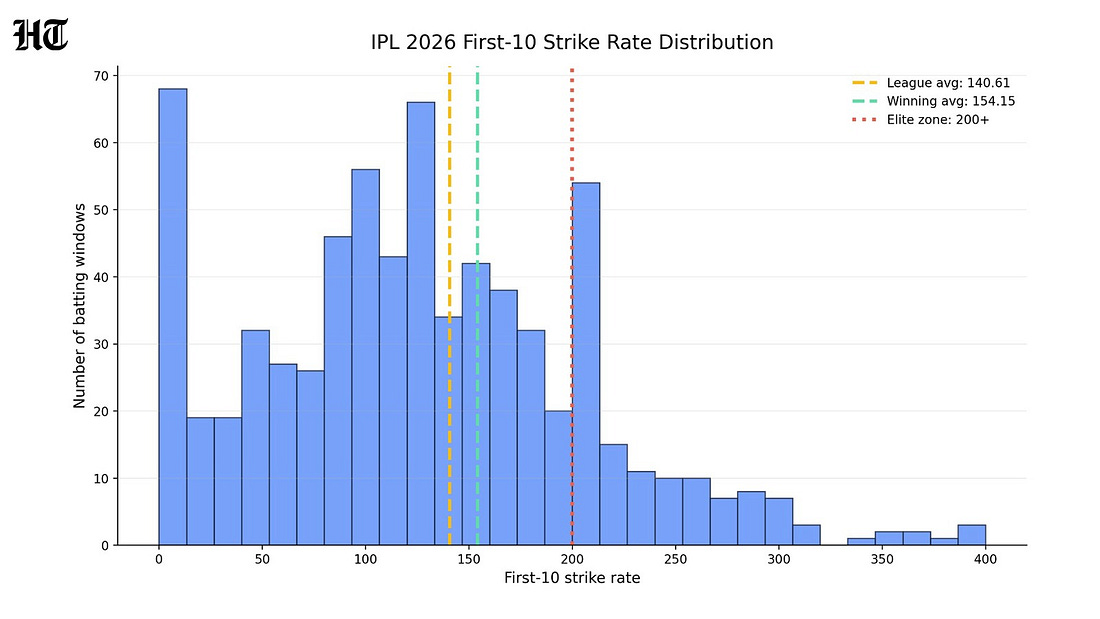
IPL 2026 has forced batting to move faster than the old T20 grammar allowed. Teams are no longer treating a batter’s arrival as a settling period. The first 10 legal balls faced by a player are now a measurable pressure point, where tempo, risk and match value begin to separate winning innings from losing ones. This analysis covers 46 IPL 2026 matches through the available impact-linked ball-by-ball dataset, isolating 702 first-10 batting windows, 5,196 balls and 7,306 runs. A first-10 window means the first 10 legal balls faced by a batter in an innings. Wides and other non-legal deliveries are excluded from the ball count. Across the dataset, batters have scored at a first-10 strike rate of 140.61. The dot-ball rate is 39.90%, the boundary rate is 20.50%, and the dismissal rate inside the window is 36.47%. These numbers show that the early phase of a batter’s innings has become an active scoring zone. The first 10 balls already carry enough speed, risk, and separation to influence the final shape of the match.
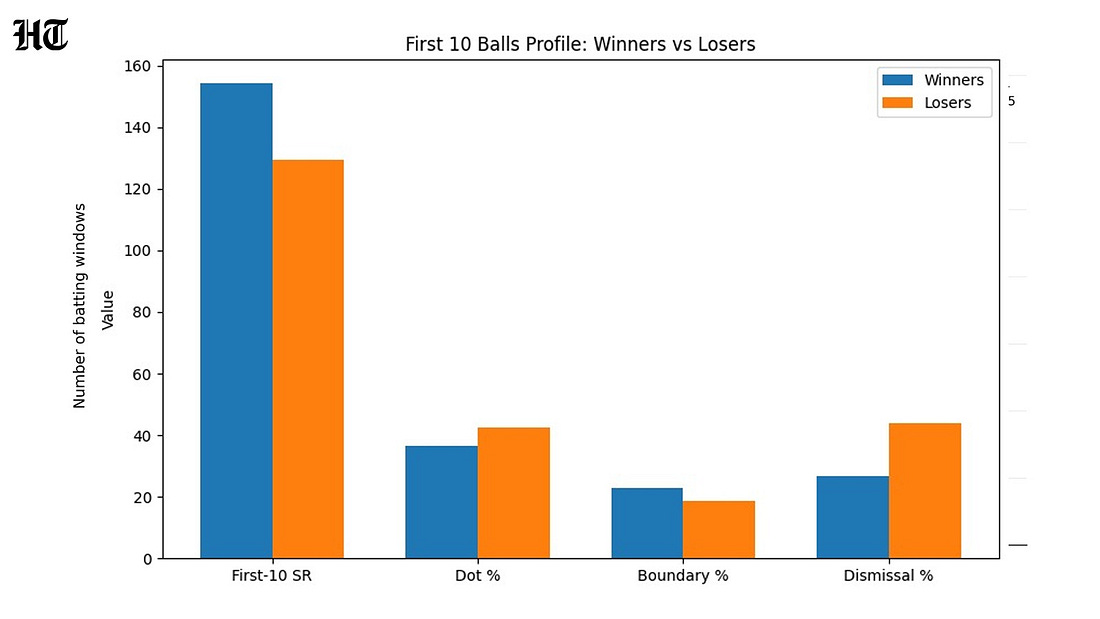
The first 10 balls separate winners from losersThe win-loss split gives the clearest evidence. Winning teams have scored at a first-10 strike rate of 154.15. Losing teams have operated at 129.24. The gap is nearly 25 runs per 100 balls. That difference appears before many batters have even reached double figures in balls faced. The dot-ball split adds another layer. Winning teams have a first-10 dot-ball rate of 36.44%. Losing teams are at 42.58%. Over every 10-ball entry window, losing sides are almost giving away one extra dot ball. In a season of inflated totals, that is a hidden tax on the innings. Boundary access follows the same pattern. Winning teams have hit boundaries in 22.73% of the first 10 balls. Losing teams have managed 18.65%. The stronger sides are finding release earlier, which prevents pressure from transferring to the next batter.
The wicket cost is sharper. Winning teams lose a batter inside the first 10 balls in 26.62% of windows. Losing teams do so in 43.77%. The best batting sides are getting faster starts with fewer early dismissals. That combination explains why this metric carries more value than raw strike rate. The first 10 balls are therefore measuring two things at once: immediate tempo and early survival. A batter who scores fast but falls too often creates volatility. A batter who survives but scores too slowly leaves the innings behind the required speed. The ideal player gives his team early movement without early damage. 20-run threshold is the hidden lineThe impact layer, measured through our model, shows a hard break between meaningful early acceleration and low-value entry. There are 90 first-10 windows where a batter scored 20 or more. Those windows have produced a win rate of 58.89%. The average batting impact in those cases, according to the model, is 57.42.
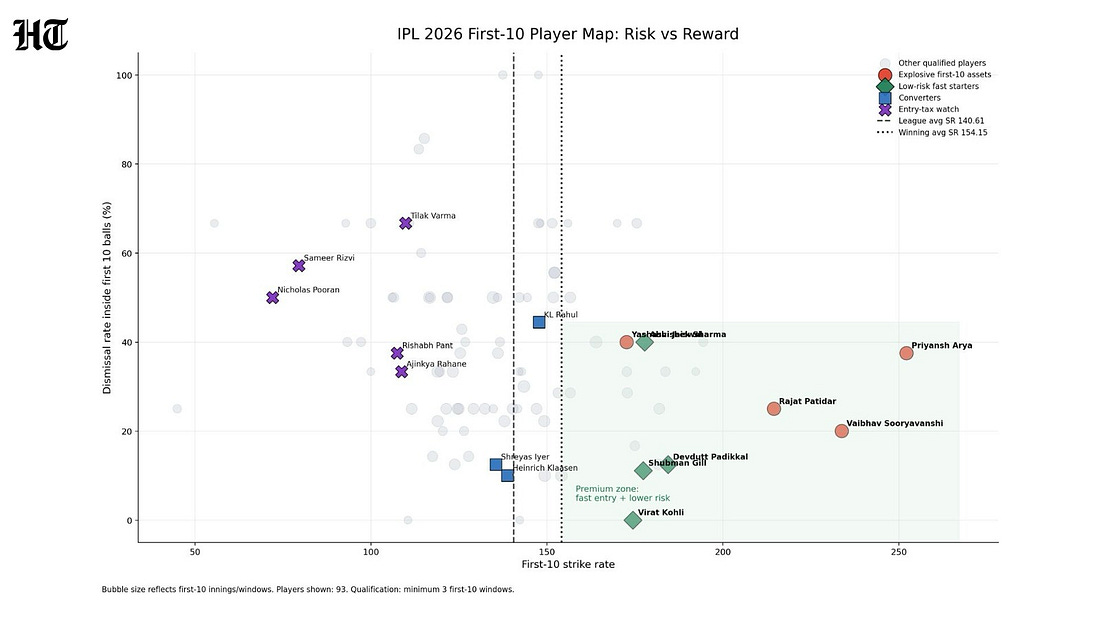
The under-10 group tells the other side of the story. There are 343 first-10 windows with 10 or fewer runs. Their win rate is 32.07%. The model’s average batting impact is 2.18. That is the cleanest analytical line in the study. A batter reaching 20 inside his first 10 balls usually gives the innings immediate value. A batter staying under 10 often leaves behind low-scoring output, high pressure, or a higher chance of dismissal. The difference is too wide to be treated as a style preference. The 20-plus group is associated with winning, high impact and immediate innings control. The under-10 group is associated with low impact and poor match conversion. Priyansh Arya the most violentPriyansh Arya is the most extreme first-10 batter in the qualified group. His first-10 strike rate is 252.17. He averages 21.75 runs in the window, with a boundary rate of 43.48%, and a six rate of 21.73%. His phase-adjusted first-10 value is +74.20 runs. The scale of his early hitting is unusual even in a high-scoring season. Almost one in every two balls he faces in the window becomes a boundary. More than one in every five balls becomes a six. He has crossed 20 inside his first 10 balls in 62.5% of his innings. The risk is visible. His dismissal rate inside the first 10 balls is 37.5%. That does not weaken the argument. It defines the asset. Priyansh is the clearest high-volatility, high-upside first-10 batter in the tournament. His 39 off his first 10 balls against CSK is the strongest single burst in the dataset. Vaibhav Sooryavanshi brings violence with lower early costVaibhav Sooryavanshi sits close to Priyansh in the violence bracket and carries a cleaner survival profile. His first-10 strike rate is 233.73. His average first-10 score is 19.40, with a boundary rate of 44.58%, slightly higher than Priyansh’s. His six rate is 18.07%. His phase-adjusted first-10 value is +73.95 runs. The dismissal rate separates the two profiles. Sooryavanshi is dismissed inside his first 10 balls in only 20% of his windows. Priyansh produces slightly higher immediate output. Sooryavanshi combines similar early force with a lower failure rate.
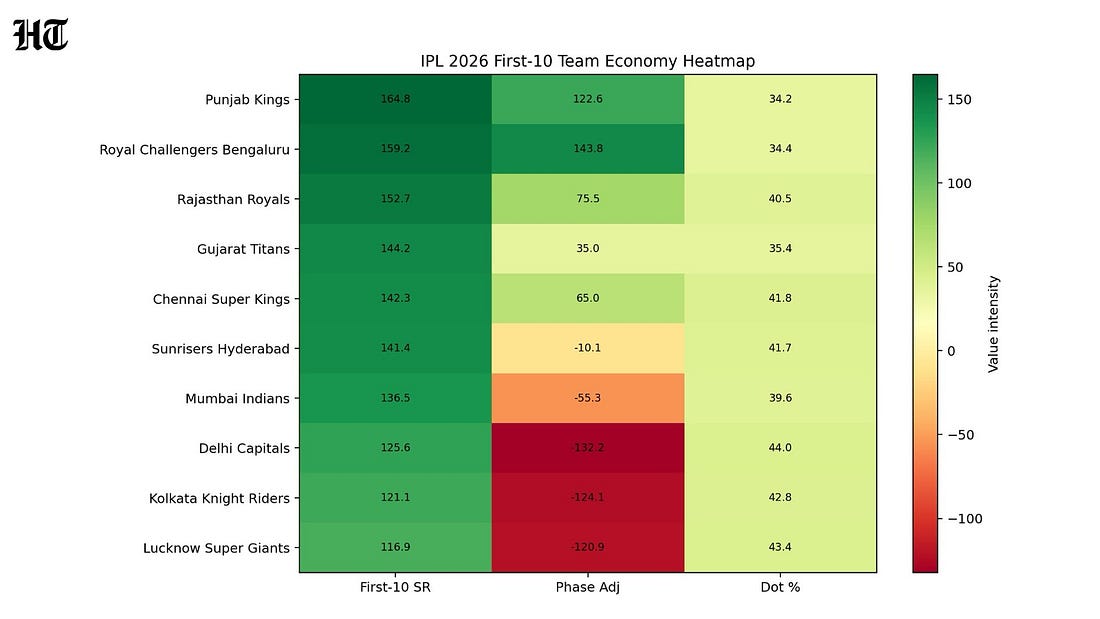
That makes his profile especially valuable. He gives Rajasthan one of the cleanest entry-speed profiles in the season: high boundary access, high strike rate, high phase-adjusted value and limited early dismissal damage. In a tournament where winning teams are striking at 154.15 in the first 10 windows, Sooryavanshi’s 233.73 places him far beyond the required pace. His value lies in the gap between his acceleration and his wicket cost. Kohli is the controlled premium versionVirat Kohli is the most revealing name in this study because he is generally not associated with attacking recklessly from the start. His T20 value has usually been linked with control, innings construction, tempo management and acceleration after entry. IPL 2026 has produced a sharper first-10 profile. Kohli’s first-10 strike rate is 174.44. His dot-ball rate is 27.78%. His boundary rate is 30%, while his dismissal rate inside the first 10 balls is 0%. He has reached 15 or more in his first 10 balls in 77.78% of his innings. That is elite early efficiency. He is scoring well above the league first-10 average of 140.61 and above the winning-team average of 154.15. He is doing it without an early dismissal in the sample. By our impact model, his average batting impact is 46.3. The first-10 data explain part of that value. He is not allowing the innings to pause when he enters. He is also not exposing RCB to early wicket loss while accelerating. Priyansh and Sooryavanshi represent the explosive edge of the metric. Kohli represents the controlled premium version. The output is fast, repeatable and low-risk. PBKS and RCB are winning the entry-speed economyThe team numbers show why the first-10 test belongs in a season-level conversation. PBKS lead the league with a first-10 strike rate of 164.7 and a phase-adjusted first-10 value of +111.9. Their batting impact by our model is 1850.2. RCB are close behind with a first-10 strike rate of 159.2, a phase-adjusted first-10 value of +101.2, and a batting impact of 1812.3 by the model. RR sit in the next band with a first-10 strike rate of 152.18 and a phase-adjusted value of +65.11. GT are at 144.00. CSK and SRH are close to neutral, with phase-adjusted first-10 values of +9.81 and +9.28, respectively. The bottom half exposes the cost of slow entry. MI are at -27.05 phase-adjusted first-10 value. DC are at -75.93. KKR are at -95.31. LSG are at -119.71.
The team pattern is direct. PBKS and RCB are creating immediate batting value at entry. LSG, KKR and DC are losing ground before their innings fully develop. There is also a match-count caveat. The study covers 46 matches. PBKS have played nine matches, but have first-10 batting windows from eight because the abandoned KKR-PBKS match had only KKR batting. RCB, SRH, RR, GT, CSK, DC, KKR, MI, and LSG have been counted based on the available batting windows in the dataset. Middle order feeling the squeezeThe position split explains why teams are leaning so heavily on openers and early hitters. Openers have scored at a first-10 strike rate of 160.00. No. 3 and No. 4 batters are at 140.00. Nos. 5 to 7 drop to 131.55. Nos. 8 to 11 are at 115.75. This creates a structural problem. If openers fail, many teams are asking middle-order players to restart innings at a lower first-10 tempo. In a season where winning teams are operating at 154.15 in the first-10 window, a middle-order entry rate near 131 creates immediate pressure.
The issue becomes sharper when individual names are studied. Nicholas Pooran has a first-10 strike rate of 72.06 and a phase-adjusted first-10 value of -44.36. Sameer Rizvi is at 79.55 with -27.56. Rishabh Pant is at 107.46 with -23.93. Tilak Varma is at 109.84 with -18.63. These figures are not complete judgments on batting quality. They measure entry cost. Some batters can recover after a slow start. Others leave the innings permanently behind the required pace. IPL 2026 is making that distinction expensive. The converter group keeps the metric honestThe first-10 test cannot become a blind strike-rate ranking. Some batters absorb a small entry cost and then produce strong innings value. Heinrich Klaasen has a first-10 strike rate of 138.8, yet his average batting impact by our model is 49.2. KL Rahul has a first-10 strike rate of 147.8 and a batting impact of 43.4. Shreyas Iyer is at 135.5 with a batting impact of 46.5. Sai Sudarshan is at 123.3 with a batting impact of 33.9. This group separates slow entry from failed entry. Klaasen, Rahul and Shreyas can still convert after the first 10 balls. Sudarshan’s profile shows a more classical accumulation route, though his first-10 pace falls short of the winning-team benchmark. The danger arrives when low first-10 output is followed by low final impact. The model does not punish every quiet start equally. It punishes quiet starts that do not compound later. The first 10 balls have become a market signalThe strongest evidence comes from the combined reading of scoring, dismissal and impact data. The league’s first-10 strike rate is 140.61. Winning teams are at 154.15. Losing teams are at 129.24. The boundary rate for winners is 22.73%, compared to 18.65% for losers. The dismissal rate for winners is 26.62%, compared to 43.77% for losers. The impact split strengthens the conclusion. First-10 windows of 20 or more runs have a win rate of 58.89% and an average batting impact of 57.42 by our model. Under-10 windows have a win rate of 32.07% and an average batting impact of 2.18. Priyansh and Sooryavanshi define the violent end of the trend. Kohli defines the controlled premium end. PBKS and RCB show the team-level value of fast entry. LSG, KKR and DC show the cost of delayed scoring. IPL 2026 has made the first 10 balls a live valuation event. Every new batter arrives with a price on tempo. Some raise it quickly. Some leave the innings poorer before they are even set. Method noteThis analysis is based on ball-by-ball and impact-linked data from 46 IPL 2026 matches, covering 702 regulation first-10 batting windows, 5,196 balls and 7,306 runs. A first-10 window means the first 10 legal balls faced by a batter in an innings. Wides and other non-legal deliveries were excluded from the ball count. Super-over data was excluded. Impact references are based on a cricket impact model developed by the author. The model studies batting, bowling, fielding, match situation, phase pressure, role difficulty, manual performance rating and captaincy impact, then converts performances into impact values. It is not an official IPL metric, salary calculation or franchise accounting figure. Thanks for reading! Subscribe for free to receive new posts from CRICKIT BY HT.
|
मंगलवार, 5 मई 2026


0 टिप्पणियाँ: